
Dashboard
Dashboard in TASQ is designed to display the key statistic data in your business, which included the following four graphs and lists.
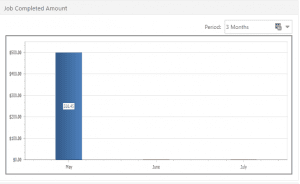
- Job completed amountis to show the total amount of completed job in past 3, 6, and 12 months.
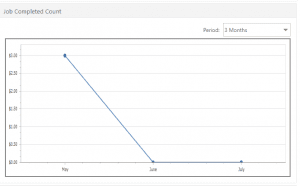
- Job completed countis to demonstrate the total job quantity completed in past 3, 6 and 12 months.
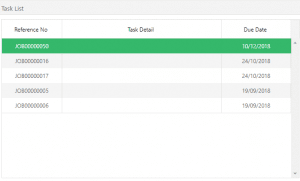
- Task list is the list for all the pending tasks which need to take action by site engineer.
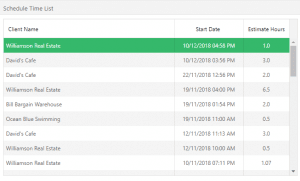
- Schedule time listis to show the schedule time for all the pending jobs.